

You’ve had a bone density scan and received a T-score. But what does that number actually mean?
DEXA (dual-energy X-ray absorptiometry) is the technology behind bone density scans, but the same technology is also used for a completely different purpose: body composition analysis. Before we unpack your T-score, it helps to know exactly which kind of scan you’ve had, because a bone density scan and a body composition scan answer very different questions.
What Is a T-Score?
A T-score is a comparison.
It tells you how your bone mineral density (BMD) – the measurement your bone density scan produces – compares with the average BMD of a healthy young-adult reference population.
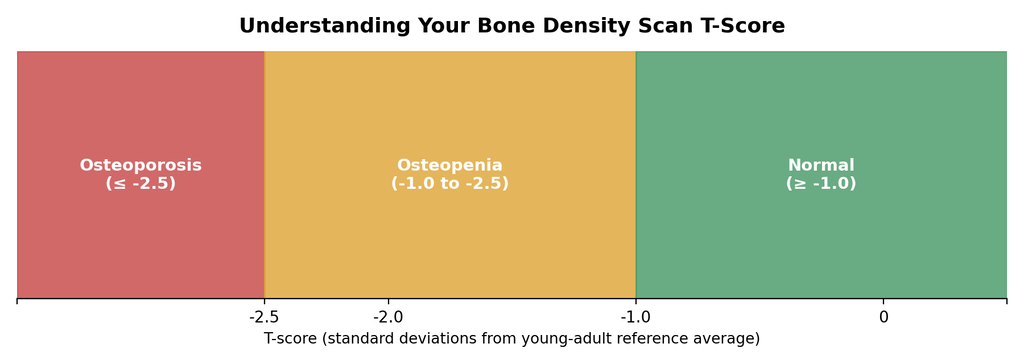
The result is expressed in standard deviations:
- 0: around the reference population average
- −1: one standard deviation below average
- −2: two standard deviations below average
- −2.5: two and a half standard deviations below average
For postmenopausal women and men aged 50 years and older, a T-score of −2.5 or lower at an appropriate site, such as the hip or lumbar spine, meets the DXA criterion for osteoporosis.
However, a T-score isn’t a diagnosis in isolation. Healthcare professionals also consider factors such as age, previous fractures, and other clinical risk factors (International Society for Clinical Densitometry [ISCD], 2023).
How Is a Bone Density Scan T-Score Calculated?
The calculation is actually quite simple.
Your measured BMD is compared with the mean BMD of the reference population, and the difference is divided by the reference population’s standard deviation.
This means your T-score isn’t simply a measure of how much bone you have. It tells you how your measured bone density compares with a specific reference population.
And that reference population matters. Different reference databases can produce different T-scores from the same BMD measurement (Binkley et al., 2005; Dimai, 2017).
Bone Density Scan vs Body Composition Scan: What’s the Difference?
Not every DEXA scan is a bone density scan, and this is one of the most common sources of confusion.
At MeasureUp, DEXA is also used to provide detailed information about body composition. Book a scan at your nearest MeasureUp location to see which is right for you. A body composition scan estimates:
- Fat mass – how much fat you carry.
- Lean mass – muscle and other non-fat, non-bone tissue.
- Body fat percentage – the proportion of your total body mass that is fat.
- Regional fat distribution – where your fat is stored throughout the body.
- Visceral adipose tissue (VAT) – an estimate of the metabolically active fat stored around the internal organs.
- Bone mineral content – an estimate of the mineral component of your skeleton.
This information can provide a much more complete picture than body weight alone.
Body Composition ≠ Osteoporosis Assessment
Here’s the important distinction.
A whole-body DEXA body composition scan can measure bone mineral content, but this doesn’t mean it’s a diagnostic bone density scan for osteoporosis.
Clinical bone density assessment generally focuses on specific skeletal sites, particularly the lumbar spine and hip, using validated protocols and reference databases.
So, while both examinations use DEXA technology, they’re designed to answer different questions.
Think of it this way:
Bone density scan asks: “How does my bone density compare with a reference population, and what does this mean for skeletal health?”
Body composition scan asks: “How much fat, lean tissue, and bone mineral do I have — and where is it distributed?”
Why Does This Matter?
Because one number rarely tells the whole story.
Two people can have exactly the same body weight but have very different amounts of muscle, fat and visceral fat.
Likewise, two people can have similar body fat percentages but very different distributions of muscle and fat.
This is why looking at fat mass, lean mass, visceral fat, regional distribution and bone-related measurements together can provide considerably more useful information than simply stepping on a set of scales.
The MeasureUp Advantage
At MeasureUp, DEXA is not simply about finding out how much you weigh.
It’s about understanding what you’re made of.
By combining DEXA body composition data with other measures of health and performance, you can establish a much clearer baseline and objectively track changes over time.
Whether your goal is building muscle, reducing excess fat, improving athletic performance or optimising your long-term health, knowing your starting point makes it easier to measure whether your strategy is actually working.
Curious how this fits with the rest of your health picture? See our guides to VO2 max and Resting Metabolic Rate testing
Don’t just measure your weight. Measure what’s behind it.
References
Binkley, N., Krueger, D., & Gangnon, R. (2005). Recalculation of the NHANES database SD improves T-score agreement and reduces osteoporosis prevalence. Journal of Bone and Mineral Research, 20(4), 595–599. https://doi.org/10.1359/JBMR.041115
Dimai, H. P. (2017). Use of dual-energy X-ray absorptiometry (DXA) for diagnosis and fracture risk assessment; WHO-criteria, T- and Z-score, and reference databases. Bone, 104, 39–43. https://doi.org/10.1016/j.bone.2016.12.016
International Society for Clinical Densitometry. (2023). Official positions 2023. ISCD Official Positions
Kelly, T. L., Wilson, K. E., & Heymsfield, S. B. (2009). Dual energy X-ray absorptiometry body composition reference values from NHANES. PLoS ONE, 4(9), e7038. https://doi.org/10.1371/journal.pone.0007038
Lee, J. Y., Lee, D. C., & Kim, J. H. (2015). Different reference BMDs affect the prevalence of osteoporosis. Osteoporosis International, 26, 2247–2253. https://doi.org/10.1007/s00774-015-0676-0